
P E R F O R M A N C E A T G L A N C E
STRATEGY FIGURES IN A NUTSHELL
![]()
MONTHLY RETURN
![]()
TOTAL GAIN SINCE INCEPTION
![]()
POINTS (PIPs)
SINCE INCEPTION
![]()
MAXIMUM DRAWDOWN (FEB 2016)
![]()
![]()
TRADES CLOSED SINCE INCEPTION
![]()
MONTHS SINCE INCEPTION
![]()
AVERAGE TRADE DURATION
![]()
MARTINGALE TRADING
![]()
Data updated since inception until 31st of January 2019
(see note on PIP calculation below)
S T R A T E G Y O V E R V I E W
SOME THINGS CAN ONLY BE EXPLAINED WITH WORDS
Arion is based in a portfolio of proven short-term technical strategies, operating daily in the foreign exchange market, aiming to grasp consistent returns, and limiting the expected drawdown. The long term targets of the strategy are 2% or more of monthly returns, limiting the maximum historical drawdown (DD) to 30%.
A short-term strategy means also that positions are aimed to be open for short periods of time, taking advantage of short term opportunities in the currencies markets. This short term view means that positions are only held open for the time period whilst the trade setup parameters defined at the open of each trade are still valid and satisfied. When the defined trade setup limits are no longer satisfied, the trade is deemed as a bad traded and quickly closed. This feature avoids dragging losing open positions in time, hoping that at some point in time the market reverses. Such type of trading, frequently found in trading strategies, increases the risks of accumulating drawdown, giving back profits to market and increases transaction costs, such as swap costs.
New coming customers might also be interested to learn that a sound sign of the robustness of the strategy is the coherence between the wealth the strategy is able to capture from the market and how this corresponds to points or “pips” gained over time. Please check the figures and charts in the next section to verify that, month after month, there’s a very strong coherence between positive returns in account equity terms and positive returns in terms of points/pips obtained from the market. A red flag of strong warning should always be raised when a positive results track record doesn’t meet also a positive pips track record. Several causes can cause this type of divergence, but one of the most common is what is called “martingale trading”, where new and larger positions are added to an already losing position hoping for a market reversal and seeking a way out of a bad trade setup, that instead of being closed at the right time by following sound trade rules, was maintained alive and with increasing relevance and risk.
The strategy doesn’t follow also what is usually known as “grid trading”, which is a similar approach to martingale, but where new positions, opened with the objective to recover what was a bad trading setup from the beginning, have the same size of the initial position. Grid trading can be eventually a less risky strategy than pure martingale, but still encapsulates what is one of the most common flaws of simpler trading strategies, which is the approach to “add to losing positions” and thus increase risk immensely, hoping for a market reversal, instead of labeling what is a bad trade setup early in time. In average trade positions in Arion are closed within less than 24h of their open, which shows the targeted and consequent nature of the strategy.
Lastly, maybe one of the most distinctive aspects of Arion relies on the effort placed to balance the portfolio to achieve the best possible setup in terms of long term expected return with lowest possible short term risk. This is done by taking advantage of the diversified nature of the portfolio and. Regularly the settings, weight and composition of the portfolio are adjusted in order diversify its risk and to continue to provide the best long term prospects possible, but with a risk exposure (measured in terms of drawdown) within strategy targets. The rebalancing of the portfolio aims to allow both peace of mind to current investors and the ability to recover, within a reasonable amount of time, to investors who, by coincidence, enter the product at one of its local peaks.
IN SUMMARY, ARION’s MAIN FETAURES:
![]()
SHORT TIME VIEW
QUICK TRADE DECISION
![]()
NO MARTINGALE/GRID TRADES
NO ADDING UP TO LOSERS
![]()
CONTINUOUS MONITORING
REGULAR REBALANCING
![]()
CONTROLLED RISK
HEALTHY LONG TERM RETURNS
![]()
Please check in the section below the aggregate performance over time.
M O N T H B Y M O N T H
BECAUSE BEHAVIOUR OVER TIME IS ALSO IMPORTANT TO YOU
2019 | Jan | Feb | Mar | Apr | May | Jun | Jul | Aug | Sep | Oct | Nov | Dez | Totals (YTD)* |
|---|---|---|---|---|---|---|---|---|---|---|---|---|---|
| Return (%) | 1.2% | 1.2% | |||||||||||
| Points (pips)** | 434 | 434 |
2018 | Jan | Feb | Mar | Apr | May | Jun | Jul | Aug | Sep | Oct | Nov | Dez | Totals (YTD)* |
|---|---|---|---|---|---|---|---|---|---|---|---|---|---|
| Return (%) | -3.6% | 1.7% | -1.8% | 4.0% | -1.2% | 7.2% | -3.9% | 1.8% | -5.1% | -5.4% | -6-3% | 1.1% | -11.8% |
| Points (pips)** | -300 | -27 | -495 | 354 | 97 | 224 | -204 | 784 | -690 | -718 | -627 | -11 | -1613 |
2017 | Jan | Feb | Mar | Apr | May | Jun | Jul | Aug | Sep | Oct | Nov | Dez | Yearly Totals |
|---|---|---|---|---|---|---|---|---|---|---|---|---|---|
| Return (%) | 3.6% | 0.6% | -2.0% | -1.9% | -1.0% | -0.2% | 0% | -4.4% | 7.4% | 2.4% | 0.7% | -3.4% | 1.2% |
| Points (pips)** | 990 | 674 | -95 | -146 | -178 | 78 | 575 | -404 | 298 | -81 | -978 | -660 | 74 |
2016 | Jan | Feb | Mar | Apr | May | Jun | Jul | Aug | Sep | Oct | Nov | Dez | Yearly Totals |
|---|---|---|---|---|---|---|---|---|---|---|---|---|---|
| Return (%) | -6.7% | 1.4% | 13.4% | -1.8% | 0.7% | 10.4% | 4.6% | 0.6% | -7.4% | -1.8% | 7.6% | 0.5% | 21.2% |
| Points (pips)** | -605 | -117 | 741 | 275 | - 63 | 1478 | 1005 | 138 | -904 | 386 | 1661 | 20 | 4015 |
2015 | Jan | Feb | Mar | Apr | May | Jun | Jul | Aug | Sep | Oct | Nov | Dez | Yearly Totals |
|---|---|---|---|---|---|---|---|---|---|---|---|---|---|
| Return (%) | - | - | - | - | - | 10.8% | 8.5% | 3.5% | 0.6% | 5.4% | -0.6% | 4.0% | 36.3% |
| Points (pips)** | - | - | - | - | - | 608 | 397 | 516 | 209 | 655 | 113 | 357 | 2855 |
* – Year to date – from January to last month reported
** – “PIP” stands for Point In Percentage. More simply a pip is what the FX would consider a “point” for calculating profits and losses. It represents a good complementary measure to assess the real merit of a strategy to capture and retain returns from the market. As of March 2017, ARION started to trade gold. Given the large divergence between a PIP value between Gold and and regular currencies, for the sake of transparency, the pip value in all Gold trades has been decreased by a factor of 10. Therefore some differences in pip values can be noticed between this page and other reports (such as MyFxbook.com) from March 2017 up to Jan 2018 (Gold trading was abandoned in this portfolio by that date).
![]()
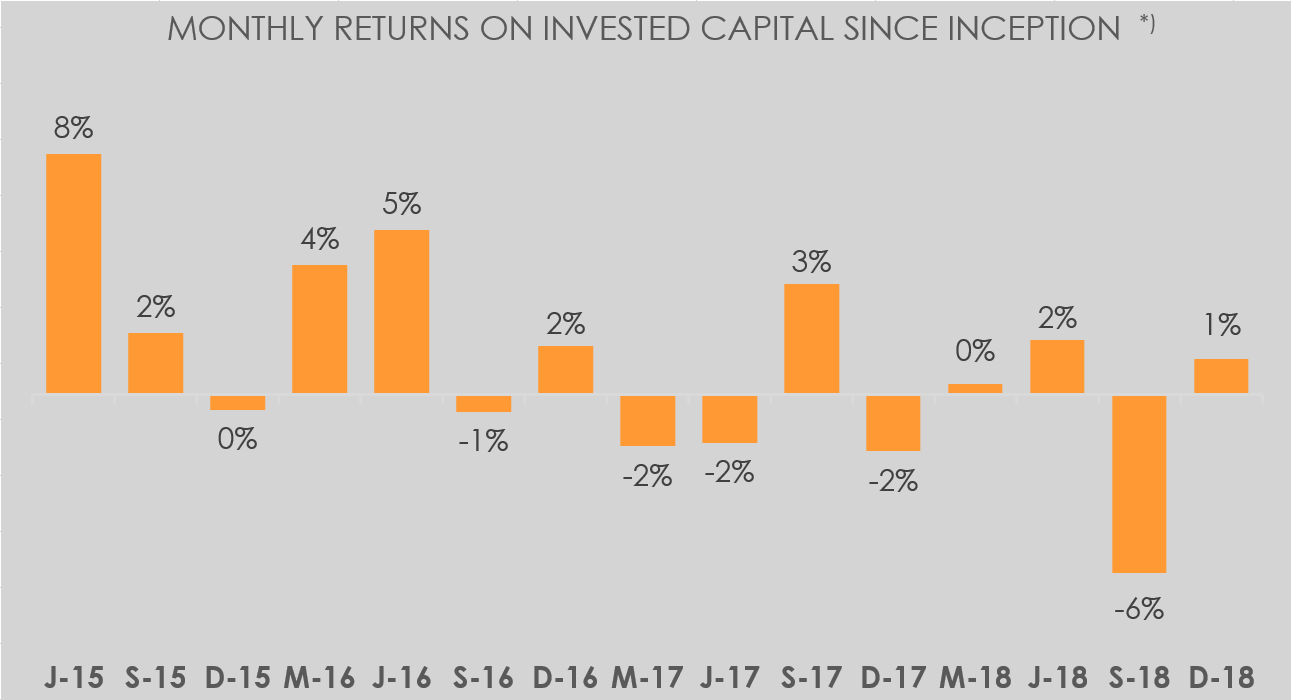
![]()
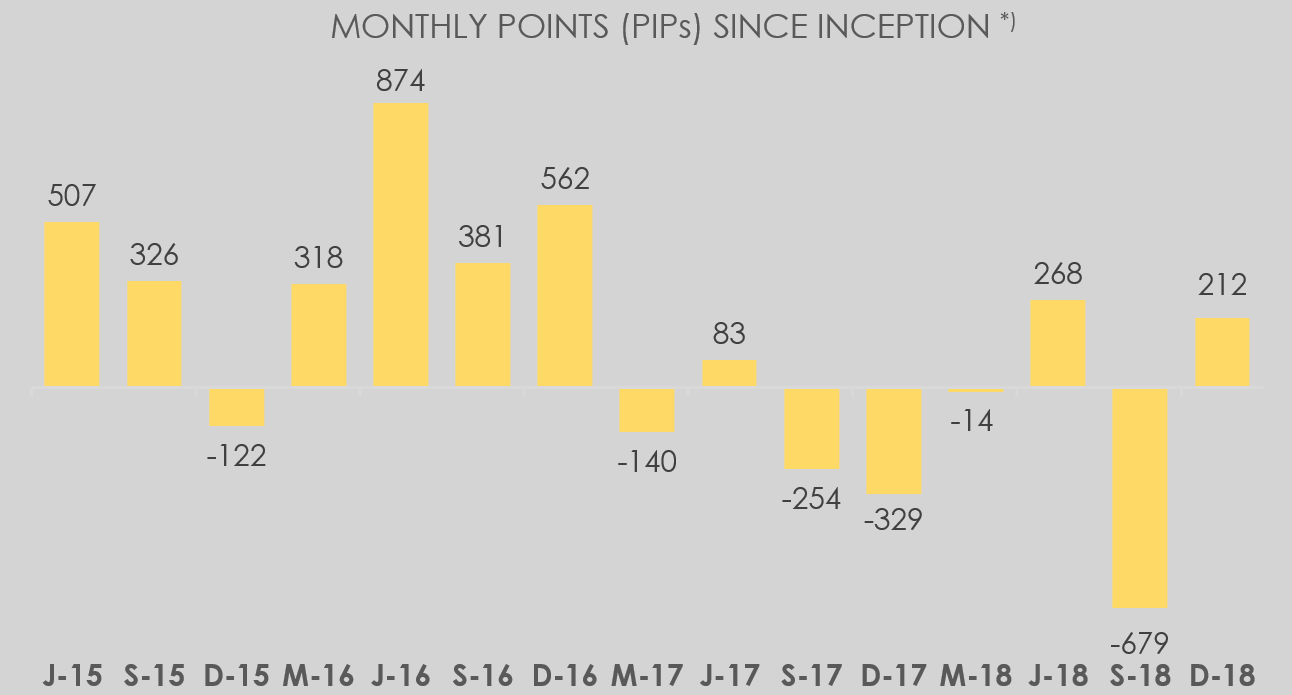
*) due to space limitation resulting from the long term of the product since its inception, each of the bars in the graphs above represents a three month average of monthly figures
EVOLUTION OF A US$ 10.000 FUNDED ACCOUNT SINCE INCEPTION
US$
(As per results in our master real money account. Gross values, excluding subscription costs, taxes or other impacts resulting from each individual situation)
N E E D R E A S S U R A N C E ?
VISIT MYFXBOOK.COM WITH STATISTICS VERIFIED BY AN INDEPENDENT SOURCE
For a prospective customer of this industry it’s of utmost importance to be able to trust the figures and performance as advertised by each vendor in its own site or marketing communication.
For us, at Odysseia Capital, we think that by providing transparency to our customers, we contribute for an even more trustful relation. That’s why we are glad to make our statistics available, as verified and validated by an independent source: Myfxbook.com. Myfxbook.com has managed to position itself as the industry standard to share and validate trading statistics in the currencies market.
We strongly advise against contracting services that don’t share openly their strategy results via an independent source such as Myfxbook.com.
Below you can find ARION’s aggregated statistics. At the left side, the actual global statistics since inception. At the right side, the equity and account balance over time. Click in any of the images to go to Arion’s Myfxbook.com page and check further statistics, as well as the indication of verified account by Myfxbook.com, which assures that the statistics have not been rigged and our account trading activity is accurately represented in the statistics presented.
The Myfxbook.com values are updated several times per day and will present some divergence with the figures at the top of this page, which are updated once per month.
![]()

![]()
![]()
R E A D Y T O GO ?
JUST CLICK BELOW AND YOU’LL BE TRANSPORTED TO THE SHOP PAGE