
P E R F O R M A N C E A T G L A N C E
STRATEGY FIGURES IN A NUTSHELL
![]()
MONTHLY RETURN
![]()
TOTAL GAIN SINCE INCEPTION
![]()
POINTS (PIPs)
SINCE INCEPTION
![]()
MAXIMUM DRAWDOWN (DEC 2018)
![]()
![]()
TRADES CLOSED SINCE INCEPTION
![]()
MONTHS SINCE INCEPTION
![]()
AVERAGE TRADE DURATION
![]()
MARTINGALE TRADING
![]()
Data updated since inception until 12th of April 2019
(see note on PIP calculation below)
S T R A T E G Y O V E R V I E W
SOME THINGS CAN ONLY BE EXPLAINED WITH WORDS
NEXUS is based in a portfolio of proven long-term technical strategies, operating daily in the foreign exchange market, aiming to grasp consistent returns, and limiting the expected drawdown. The long term targets of the strategy are 2% or more of monthly returns, limiting the maximum historical drawdown (DD) to 25%.
WHY DOES NEXUS MAKES SENSE FROM AN INVESTMENT POINT OF VIEW:
A long-term strategy means that positions will be open for longer periods of time, taking advantage of larger trends and opportunities in the currency markets. Riding larger price movements at the same time an obsessive risk control is in place, sets the strategy to maximize benefit from interesting market opportunities, without exposing the portfolio to excessive risk.
Please see above how large was the maximum drawdown ever experienced in the portfolio, or visit the bottom of the page for more granular information.
An almost obsessive risk control allied with an approach of regular portfolio reviews aims for long term-profitable survival. Sure, there will be periods of stagnation and even some rather prolonged drawdowns and that’s normal. Our vision is that NEXUS offers an unmatched performance in terms of risk vs return.
Finally, NEXUS offers a unique optionality to customers. To start there’s not many FX portfolios that focus mainly on long-term trading and even less with the same approach with which NEXUS is managed. It makes sense to subscribe NEXUS from a strictly investment diversification point of view.
WHY DOES NEXUS MAKES SENSE FROM A BROKER ROBUSTNESS POINT OF VIEW:
Unlike portfolios based on short-term strategies, the behavior of NEXUS is expected to be much more robust with different brokers, since the trades that compose the core of the expected returns are designed to capture longer term/higher return trends.
Therefore, effects of smaller importance, such as spread, commission or slippage, which only occur once or twice per trade, are expected to alter the portfolio’s returns only in a marginal fashion.
This is why, regarding spread, commission or slippage – assuming they remain within normal ranges – different brokers should not result in a very different performance in comparison with our Master NEXUS account.
WHY DOES NEXUS MAKES SENSE FROM A STRATEGY ROBUSTNESS POINT OF VIEW:
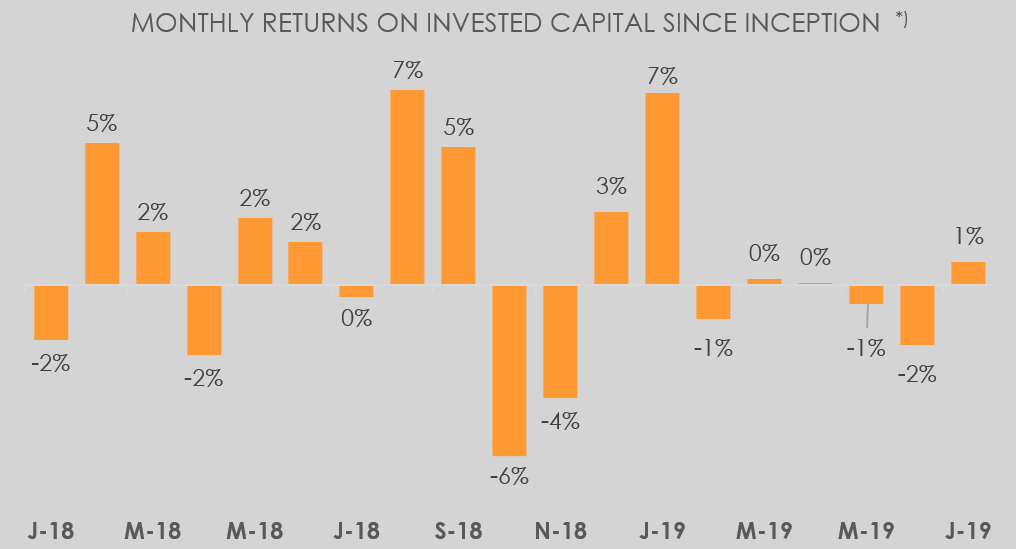
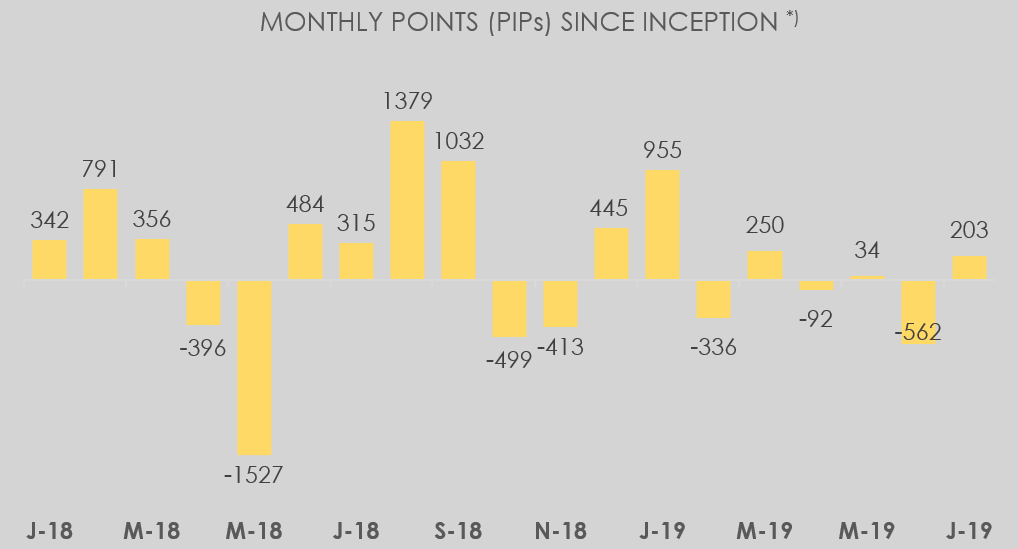
Novice traders might also be interested to learn that a good sign of the robustness of a strategy is the coherence between the profits that the strategy is able to capture from the market and how this corresponds to points or “pips” gained over time. Please check the figures and charts in the next section to verify that, month after month, there’s a very strong coherence between positive returns in account equity terms and positive returns in terms of points/pips obtained from the market. A r ed strong warning flag should always be raised when a positive money result track record doesn’t meet also a positive pip track record. Several causes can cause this type of divergence. One of the most common is what is called “martingale trading”, where new and larger positions are added to an already losing position hoping for a market reversal and seeking a way out of a bad trade setup. So instead of a trade being closed at the right time by following sound trade rules, the trade was maintained with increasing lot size and hence risk. NEXUS does NOT use martingale.
NEXUS also does NOT use what is known as “grid trading”, which is a similar approach to martingale, but where new positions, opened with the objective to recover what was a bad trading setup from the beginning, have the same size of the initial position. Grid trading can eventually be a less risky strategy than pure martingale, but still encapsulates what is one of the most common flaws of simpler trading strategies, which is the approach to “add to losing positions” and thus increase risk immensely, hoping for a market reversal, instead of closing what is a bad trade setup early in time.
Although NEXUS does NOT use martingale or grid, NEXUS can apply, in certain conditions, what are called “scale-in” trades. These are trades to reinforce or add to an initial position, depending on the way the market has developed since the initial trade was opened. The “scale-in” trades can be used to reinforce what is already a good trade setup, or to compensate a trade that, although still appearing good, has been revealed not to have been opened at the optimal entry point.
The points above are not insignificant at all, as this is one of the main reasons why signal services often fail. NEXUS is immune to those risks.
WHY DOES NEXUS MAKES SENSE FROM ACTIVE MANAGEMENT POINT OF VIEW:
Lastly, maybe one of the most distinctive aspects of NEXUS relies on the effort placed to balance the portfolio to achieve the best possible setup in terms of long term expected return with lowest possible short-term risk. This is done by taking advantage of the diversified nature of the portfolio and the possibility to remove or add sub-strategies that are adapted to market conditions. Quarterly, the settings, weights and composition of the portfolio are adjusted in order to diversify risk and to continue to provide the best long-term prospects possible, but with a risk exposure (measured in terms of drawdown) within strategy targets. The re-balancing of the portfolio aims to give both peace of mind to investors and the ability to recover, within a reasonable amount of time, for investors who, by coincidence, enter the subscription at a local equity high. The quarterly assessment is performed using in-house analytics and contrasting results of the portfolio with expectations from extensive back-testing and long-term historical limits.
SOME POINTS TO WATCH OUT
WATCH YOUR SWAPS:
As positions might remain open for longs periods, swap costs might mount up over time. True, some brokers offer positive swaps for some instruments either for the long or short side of the trades. However, considering both the short and long sides, the net value of the swap cost will usually be negative. How negative, depends not only on Central Banks interest rate policies, but also on the specific commercial conditions the brokers themselves apply to their customers. Therefore, before you choose your broker to host your NEXUS client account, we recommend to include in your due diligence investigation to select your broker, the element of swap costs. The general rule, regarding swaps, is that brokers with lower swap costs (considering both possible sides of the trade, long/short and also all the currencies traded at NEXUS) are better to host your NEXUS client account. Naturally, all the other aspects you consider relevant when selecting a reliable and credible broker should also govern your selection.
To assess the swap situation, it’s important to know which instruments the strategy trades. NEXUS can vary the traded instruments over time, so the best option is to visit the NEXUS MyFxBook page (find direct link at the bottom of the page – click on the graph) and in there use one of the several possible tools or views, to learn about which financial instruments have been recently traded by NEXUS. If you have any questions, don’t hesitate to contact us.
COMMIT ENOUGH CAPITAL:
As a general rule of thumb we recommend that customers warrant a minimum balance of 7,500 USD in their MT4 brokerage account hosting the Odysseia Capital trading engine. This amount will increase the probability for customers to enjoy enough profitability to justify the subscription of the service. As an absolute minimum, customers should maintain no less than 5,000 USD of balance in their brokerage account. We refer this to be the minimum, as lower balances will have the potential to increase account risk and drawdowns beyond our foreseen limits, at the same time, profits might not be large enough to justify the subscription fee.
DO YOUR DUE DILIGENCE:
Lastly, as always, any prospective customer is strongly recommended to assure his/her own due diligence when engaging in any of Odysseia Capital’s services, take notice of the respective Terms and Conditions (here) and be sure that the service to subscribe fits the customer own objectives and tolerance to risk.
IN SUMMARY, NEXUS’ MAIN FEATURES:
![]()
LONG TIME VIEW
RIDE THE LARGER TREND OPPORTUNITIES
![]()
HIGHLY CONTROLLED RISK
HEALTHY LONG TERM RETURNS
![]()
NO MARTINGALE/GRID TRADES
NO ADDING UP TO LOSERS
![]()
CONTINUOUS MONITORING QUARTELY REBALANCING
![]()
Please check in the section below the aggregate performance over time.
M O N T H B Y M O N T H
BECAUSE BEHAVIOUR OVER TIME IS ALSO IMPORTANT TO YOU
2019 | Jan | Feb | Mar | Apr | May | Jun | Jul | Aug | Sep | Oct | Nov | Dez | Totals (YTD)* |
|---|---|---|---|---|---|---|---|---|---|---|---|---|---|
| Return (%) | 6.9% | -1.2% | 0.2% | 0.1% | -0.7% | -2.1% | 0.8% | 3.8% | |||||
| Points (pips)** | 955 | -336 | 250 | -92 | 34 | -562 | 203 | 452 |
2018 | Jan | Feb | Mar | Apr | May | Jun | Jul | Aug | Sep | Oct | Nov | Dez | Totals (YTD)* |
|---|---|---|---|---|---|---|---|---|---|---|---|---|---|
| Return (%) | -2.0% | 5.1% | 1.9% | -2.5% | 2.4% | 1.5% | -0.4% | 7.0% | 4.9% | -6.1% | -4.0% | 2.6% | 10.0% |
| Points (pips)** | 342 | 791 | 356 | -396 | -1527 | 484 | 315 | 1379 | 1032 | -499 | -413 | 445 | 2308 |
* – Year to date – from January to last month reported
** – “PIP” stands for Point In Percentage. More simply a pip is what the FX would consider a “point” for calculating profits and losses. It represents a good complementary measure to assess the real merit of a strategy to capture and retain returns from the market.
![]()
*) values rounded to the nearest unit
EVOLUTION OF A US$ 10.000 FUNDED ACCOUNT SINCE INCEPTION
US$
(As per results in our master real money account. Gross values, excluding subscription costs, taxes or other impacts resulting from each individual situation)
N E E D R E A S S U R A N C E ?
VISIT MYFXBOOK.COM WITH STATISTICS VERIFIED BY AN INDEPENDENT SOURCE
For a prospective customer of this industry it’s of utmost importance to be able to trust the figures and performance as advertised by each vendor in its own site or marketing communication.
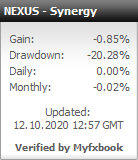
For us, at Odysseia Capital, we think that by providing transparency to our customers, we contribute for an even more trustful relation. That’s why we are glad to make our statistics available, as verified and validated by an independent source: Myfxbook.com. Myfxbook.com has managed to position itself as the industry standard to share and validate trading statistics in the currencies market.
We strongly advise against contracting services that don’t share openly their strategy results via an independent source such as Myfxbook.com.
Below you can find NEXUS’ aggregated statistics. At the left side, the actual global statistics since inception. At the right side, the equity and account balance over time. Click in any of the images to go to NEXUS’ Myfxbook.com page and check further statistics, as well as the indication of verified account by Myfxbook.com, which assures that the statistics have not been rigged and our account trading activity is accurately represented in the statistics presented.
The Myfxbook.com values are updated several times per day and will present some divergence with the figures at the top of this page, which are updated once per month.
![]()
![]()
![]()
R E A D Y T O GO ?
JUST CLICK BELOW AND YOU’LL BE TRANSPORTED TO THE SHOP PAGE