BROKER CHALLENGE – A new look on FXCM
Some days ago we have published in our blog our first conclusions of the broker challenge we started in September 2016. In that blog entry, we have made several considerations on each of the brokers and we have highlighted FXCM as being a very promising broker.
We bring back the following table published in our last blog entry.
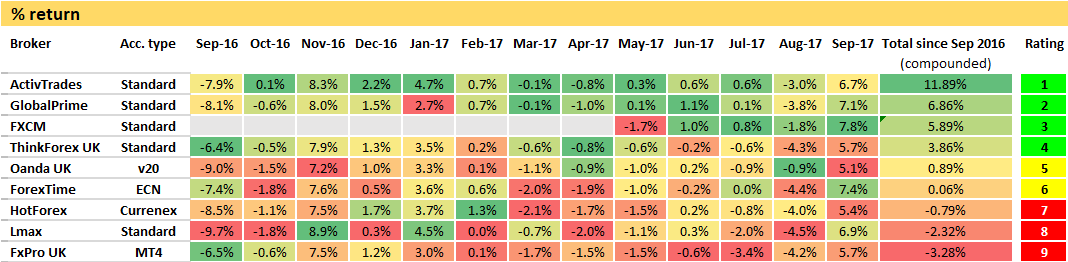
In fact, if we had computed the percent return of the time period since the FXCM was started, we would have had the following results in the total compounded return for the top 3 accounts:
1st – FXCM: 5.9% return
2nd – ActivTrades: 5.0% return
3rd – GlobalPrime: 4.3% return.
The apparent excellent results from FXCM since May intrigued us and made us want to go deeper and learn more. What we found wasn’t a totally pleasant surprise.
It appears that the rollover swaps and commissions charged by FXCM are not recorded as commission or as rollover swaps as an integral part of the trade, but rather as separate withdrawals and deposits (in the this last case only in positive rollover swaps).
Take a look at typical FXCM trade record in MyFxbook from where we drew our aggregated results to our study.
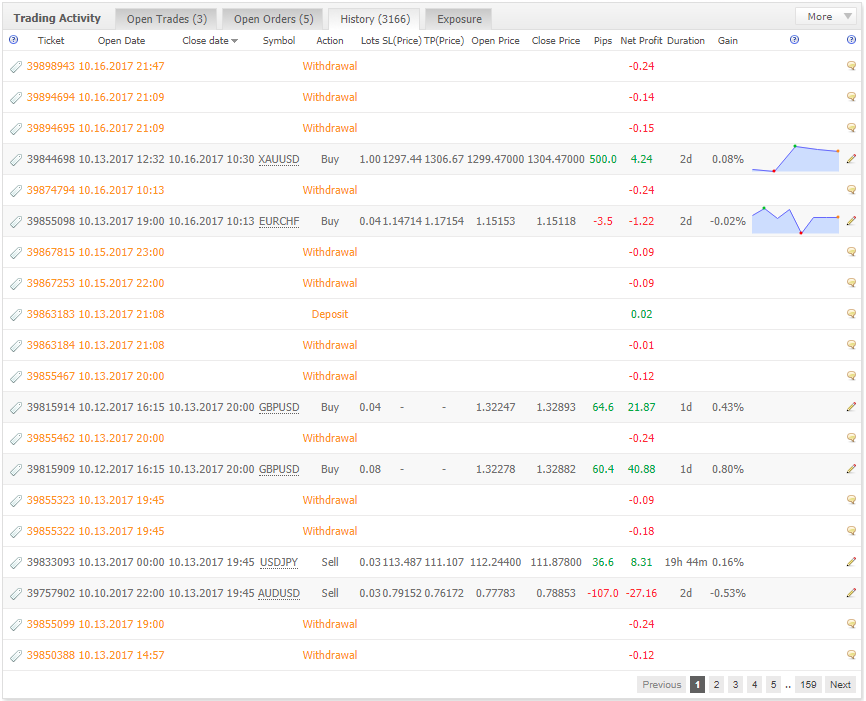
It’s evident the high number of associated extra transactions (withdrawals and deposits) resulting from each single trade. The problem occurs because that these transactions are (correctly) not accounted by MyFxbook as swaps and commissions being part of the trading activity, but rather just for what they are (according with the way they were recorded): as withdrawals and deposits.
Withdrawals and Deposits shouldn’t affect trading performance indicators, but commissions and swaps should definitely be accounted for as they are part of the cost model for the trader in accordance with the revenue system the broker implements at the core of its business model.
With FXCM we face then a rather peculiar situation where the main performance indicators associated with the trading as published by MyFxBook don’t represent the net performance for the trader. However, the MyFxBook reported figures are closer to the performance a trader would have if there would be no brokerage costs (namely swaps and commissions). On one hand, this brings some transparency, as one can easily now understand how high are the costs and how much from one’s trading success is landing in the broker pocket, but on the other it also creates confusion as the overall performance figures such as returns, profit and growth charts as published by MyFxBook (and to which the trader’s eyes are naturally drawn to) are simply and factually incorrect, indeed very incorrect.
So, returning to our broker challenge, regarding FXCM we have to compute, month per month, the impact of the broker’s costs which are wrongly recorded as withdrawals/deposits. The following table, after corrections results:

The first conclusion we see take is that, after all, since May the overall return for FXCM was not 5.9% as previously thought, but of 3.5%.
A divergence in a 5 month return of 2.4% it’s a huge difference for a strategy aiming to get a couple of percent per month. Mind you, that FXCM still seems to be performing well as it maintains itself in the top 3 brokers’ ranking for the 5 months it has been trading (surpassing Thinkforex which during these months had a return of -0.2%). However, we ask ourselves what makes a broker to record costs, including commissions, in such a strange and awkward fashion. We can only come up with the explanation that the aim is of creating information asymmetry, when so many traders in the community are using reporting tools such as MyFxBook. in fact , with FXCM it seems at first sight, that one is achieving a very interesting performance, but a closer look will tell us that almost of half of the “performance” shown by MyFxBook is, after all, going directly to the broker’s pocket.
We had already encountered similar practices in other brokers but restricted to rollover swaps, which cause much less impact in MyFxBook performance indicators. For instance in our now “retired-from-challenge” Oanda account , you can verify that since inception in September 2016, only 88 Eur were subtracted from the account in rollover swaps (and recorded as withdrawals), whereas in a FXCM account, of the same size and trading equal position sizes, in 5 months about 280 Eur were withdrawn, this because FXCM also records commissions (not only swaps) as withdrawals. Concerning rollover swaps, even if it annoys a bit because it impacts MyFxBook performance indicators, we can understand the concept behind it: what the broker aims is to charge you on a daily basis for the financing costs (swaps) as they are occurring in your account since positions can remain open for long times. Luckily, other brokers embed the swap in the overall trade cost and only effectively charge you when the trade is closed. In this last model, each trade enclosed all the costing information related with it and the net profit you see will be the final net profit of the trade.
So, what can we conclude from this lesson:
- Brokers go a great length to create the maximum information asymmetry possible, are at least to present you information in the more pleasant way possible to make their case (i.e. to maximize their revenues).
- It’s good to the broker that you think you are gaining more than you effectively are. This builds confidence and encourages trading. The more the trading the more the broker wins in commissions, spreads etc.
- Even experienced traders can be tricked when observing a MyFxBook report. That was what happened to us. The close to 6% return shown by FXCM MyFxBook was, after all, no more than 3.5%.
- Short term strategies aiming for low pip gains per trade (such as Arion) are much more prone to be affected by this phenomenon, as the lump sum commission doesn’t depend on the gain/loss made or the time each trade is open, but on the position size and number of trades.
- Traders have to be on high alert when analyzing their performance, especially on short term trading strategies, like Arion. This is also particularly true when analyzing the performance of service vendors such as ourselves in MxFxBook. Is the aggregated key performance indicators real ? Can they really be taken for face value ?
- Traders should question brokers why do they opt for this kind of awkward recording practices and tell them they are not happy with it. That’s what we’ll do with FXCM.